For Windows
MINEQL+ 5.0 is now free.
No strings. No kidding.
MINEQL+ 5.0 is now free.
No strings. No kidding.
Jan 2024 - MINEQL+ moves to a freeware license.
Sept - 2015 MINEQL+ 5.0 is released with New Wizards, better output management, new graphics and reports, and easy to add surface complexation or redox options. Hundreds of small improvements.
Sept - 2007 Vista compatible, 32-bit, version 4.6 is released.
May - 2002 Version 4.5: Thermodynamic database is upgraded, documented and conforms to USEPA standards. All reaction data is referenced.
Sept - 1998 Version 4.0: Windows, 16-bit version released. Numerical stability locked in for wide range of chemical conditions. New report writing features. Titrations, sensitivity analysis, processing of huge datasets now possible.
June - 1992 Version 3.0: DOS, 8-bit version is released. First spatial user interface for MINEQL. Tableau view of input data. Object oriented management of output data to fit any application. MINTEQ data is included.
Prior to our work:
Late 1980's USEPA combines MINEQL numerical code and the USGS's WATEQ thermodynamic data to produce MINTEQ.
1987 At MIT, Dave Dzombak collects Two Layer surface complexation data for a wide range of aqueous ions on FeO
Early 1980's The USGS develops a chemical equilibrium program called WATEQ. Their work continues throughout the decade to provide critical review of thermodynamic data.
1980 MINEQL "+Stanford" (because of the work at Stanford University) provides electrostatic surface complexation reactions within MINEQL.
1975 MINEQL is developed at MIT, by John Westall and Francois Morel. The FORTRAN program uses a generic tableau approach to describe equilibria and mass balance in aqueoous systems.
1972 REDEQL is developed by James Morgan and Francois Morel. First chemical equilibrium program with a vast scope of application. Becomes the prototype for MINEQL.
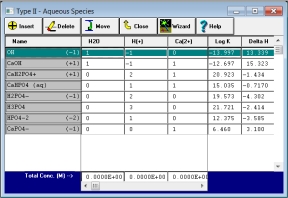
The Tableau Tool. Get a complete picture of what you are doing, by seeing all of your reaction data before running a calculation. The newest Tableau Tool is scalable, so that you can see large problems in a single view.
New MINEQL+ 5.0 Features
Check out what version 5.0 has to offer.
Check out what version 5.0 has to offer.
Calculation Wizards. The Calculation Wizards now give you greater control over system setup. pH, CO2, fixed ions, gases, solids and redox can all be set from one tool. For more information related to the Gibbs Phase Matrix, see our tutorials.
Titrations and Multiple Runs. Generate synthetic titrations, run sensitivity analysis, or process field data from an external file. The new MultiRun Manager is easier to use and provides greater flexibility.
Output Management.
The new Output Manager allows you to view your data from any angle and provides a lens to quickly summarize calculation assumptions, produce reports, export data and compare output data objects.
The new Output Manager allows you to view your data from any angle and provides a lens to quickly summarize calculation assumptions, produce reports, export data and compare output data objects.
Plots and Graphics. Alpha distribution, log C -pH, titration curves, adsoption isotherms, saturation idexes and more. Combine several components on one plot, or generate plots with one, two, or three panels
MINEQL+ is used in over 700 colleges and universities worldwide for teaching and research.
MINEQL+ is the perfect tool for performing, visualizing, and managing chemical equilibrium calculations. For both the beginner and the professional, MINEQL+ is useful in education, research, and consulting.
MINEQL+ is the perfect tool for performing, visualizing, and managing chemical equilibrium calculations. For both the beginner and the professional, MINEQL+ is useful in education, research, and consulting.
A Simple Approach to Complex Systems
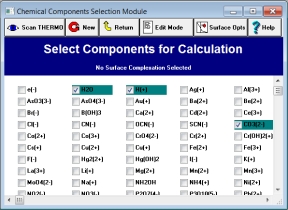
1. What chemical components are in the water? In MINEQL+, you use your mouse to select ions from a menu of over 145 components. Since every component available in the MINEQL+ database is listed on-screen, nothing is hidden.
2. How do these components interact with one another? MINEQL+ uses the USEPA database of thermodynamic constants as a starting point for defining the reactions in any aqueous system. Press a single key to load in all the complexation, precipitation/dissolution/adsorption, or redox reactions for your set of chemical components.
3. What is the total concentration of each component? Easily type in the molar values for each component using a Tableau tool, or use one of the advanced Calculation Wizards.


Copyright (c) 2024 All Rights Reserved

